What is Demand Forecasting?
The demand of any product can be forecasted by estimating the shipments an organization has made in the past, this allows us to pro-actively optimize our production schedule so that we don’t lose any potential business and at the same time we also don’t invest in excess inventory thereby leading to better cashflow and a lower possibility of overstock, this process of forecasting the demand has been around for a while now but mostly has been a pretty haphazard and Ad-hoc approach where Business Analysts try to forecast the demand with simple time series algorithms, also the traditional process of doing that only involved leveraging the historical datasets. Now with the power of modern cloud and in-memory Big Data Engine such as Apache Spark we can even co-relate external any external factors that may be responsible for driving a part of our demand such as:
- Demography,
- Weather conditions
- impact of competition.
This co-relation tends to give us a better insight into our demand thereby leading to a better accuracy moreover we can now leverage all the modern AI/ML algorithms like:
- Random Forest,
- Gradient Boosting
- Neural networks
and run them at scale on our enterprise data as compared to traditional time series algorithms.
Methodology to Forecast the Demand
We need to first get our Enterprise Data in Azure from SAP ERP so that we can start applying all the latest and greatest algorithms in a scalable and distributed platform such as Azure Databricks (manged service of Apache Spark). After getting the data into Azure we start data cleaning/massaging to train a predictive machine learning model on it. After training the model we visualize the forecasts on a comprehensive BI tool such as Power BI and also deploy the model on Azure ML so that we can call our forecasts from any third party application
So in order to quickly summarize we are going to do the following:

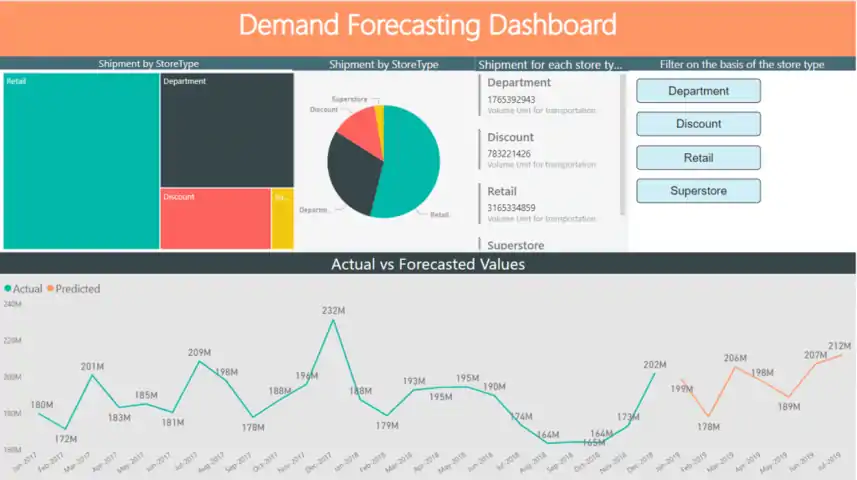
PowerBI Dashboard
- Pull data into Azure using a managed ETL/ELT service called Azure Data Factory
- Read the data from Azure Data Lake in a Spark Data frame
- Train the machine learning model in Azure Databricks
- Visualize the results on Power BI
- Deploy the model on Azure ML
Detailed Steps:
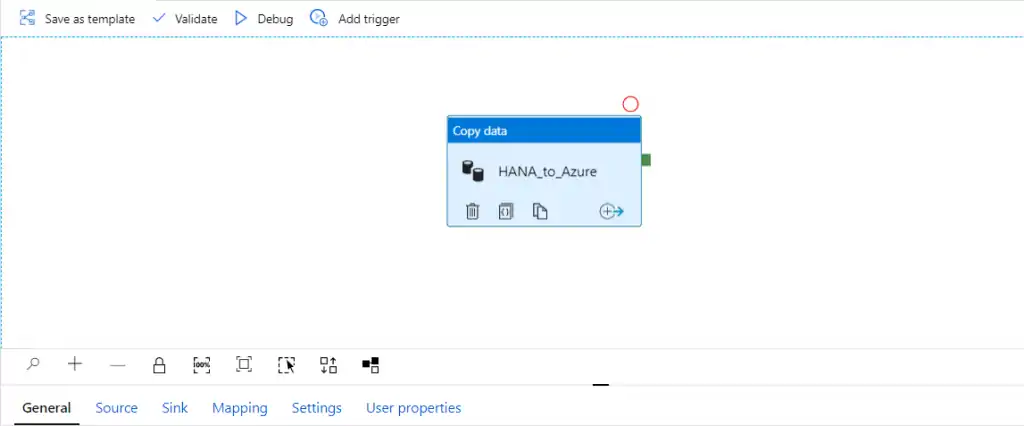
Azure Data Factory Pipeline
[/vc_column_text]
[/vc_column][/vc_row]
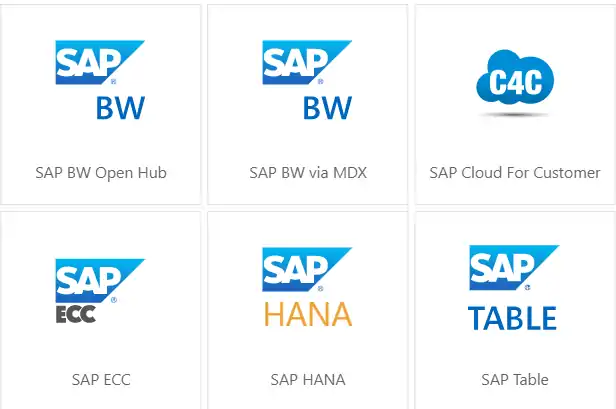
In the pipeline depicted in the above image our source is SAP HANA and we are using the HANA connector that is provided in Azure Data Factory as a standard offering
Databricks Notebooks
Once the data is into Azure Data Lake we start reading the data in the Spark Data Frames with a single line of code
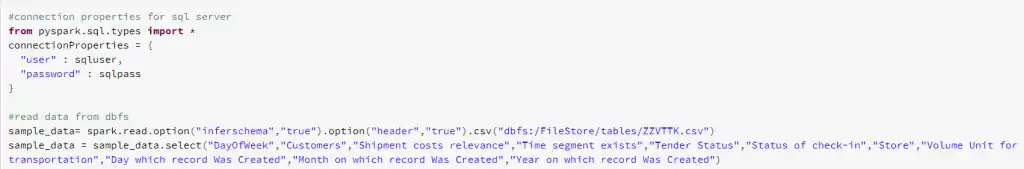
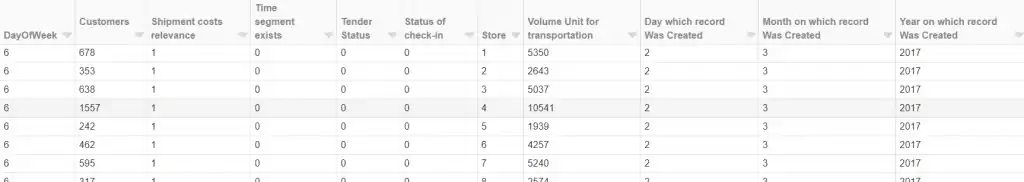
SAP Data in a Spark Data Frame
After this we are going to apply very simple spark based transformations where we convert the categorical variables into numerical ones so that we can build a Machine Learning model on it. In this scenario we are going to use GBT Regression using Apache Spark MLlib and then forecast the
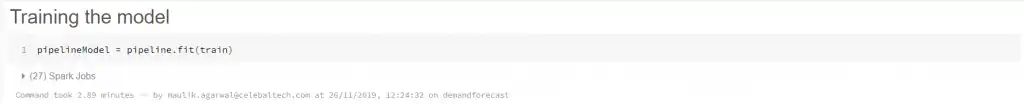
We finally the train the model and have our forecasts and quickly visualize the results in Databricks graph
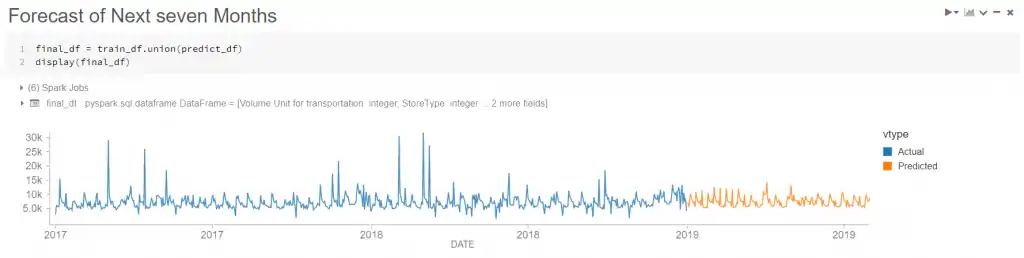
Quick Visualization of ML Model results
Power BI Dashboard
Using Databricks we populate the forecast results in an Azure SQL Database and then visualize them on a Power BI Dashboard.